PhysX Visual Debugger (PVD)
PVD
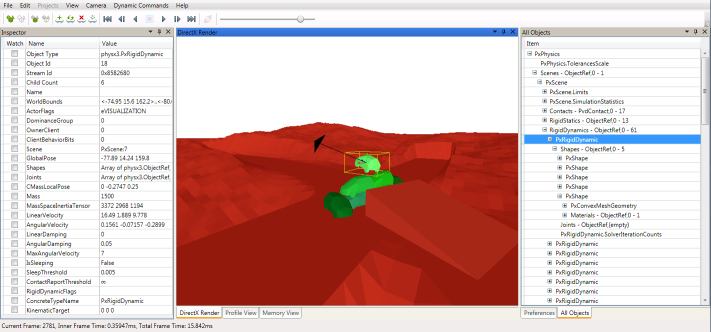
The PhysX Visual Debugger (PVD) provides a graphical view of the PhysX scene and includes various tools to inspect and visualize variables of every PhysX object. Additionally it can also record and visualize memory and timing data.
PVD can be downloaded from: http://supportcenteronline.com/ics/support/default.asp?deptID=1949
Questions regarding the usage of the GUI should all be answered by its detailed built-in help.
Basic Setup (SDK Side)
PVD integration is enabled in the debug, checked and profiling configurations of the SDK. In order to reduce memory footprint and code size, it is not enabled in the release configuration.
The SDK outputs the PVD debugging data in form of a stream. PVD supports reading the stream either from a TCP/IP network socket or from a file.
Network Setup
Streaming to TCP/IP is supported on almost all platforms, and is usually the most convenient way to collect PVD data. In this mode the stream can be watched in real-time, depending on network speed and scene complexity. In network mode PVD acts as a TCP/IP server and must therefore be launched before the SDK tries to connect to it. The default listening port is 5425:
use namespace physx;

PxPvd*  pvd = PxCreatePvd(*foundation);
PxPvdTransport* transport = PxDefaultPvdSocketTransportCreate(PVD_HOST, 5425, 10);
pvd->connect(*transport,PxPvdInstrumentationFlag::eALL);

PxPhysics* physics = PxCreatePhysics(PX_PHYSICS_VERSION, *gFoundation, PxTolerancesScale(), true, pvd);

//After releasing PxPhysics, release the PVD
physics->release();
pvd->release();
transport->release();
File Setup
Streaming to file is an alternative to network streams. This is the recommended fall-back in case your platform or system setup does not support a network connection to PVD. File streams are often faster than network sockets and therefore a good alternative if performance is more important than real-time viewing. Streams stored as files can be loaded by drag&drop or over the File->Load menu in PVD:
use namespace physx;

PxPvd*  pvd = PxCreatePvd(*foundation);
PxPvdTransport* transport = PxDefaultPvdFileTransportCreate(filename);
pvd->connect(*transport,PxPvdInstrumentationFlag::eALL);

PxPhysics* physics = PxCreatePhysics(PX_PHYSICS_VERSION, *gFoundation, PxTolerancesScale(),true, pvd);

//After releasing PxPhysics, release the PVD
physics->release();
pvd->release();
transport->release();
Advanced Setup
Connection Flags
To optimize the stream size we provide flags to enable specific features. This has both influence on PVD's and the SDK's performance:
- PxPvdInstrumentationFlag::eDEBUG: Transfer all debug data to visualize and inspect objects. This flag has usually the biggest impact on the stream's size.
- PxPvdInstrumentationFlag::ePROFILE: Transfer timing information of various profiling zones in our SDK.
- PxPvdInstrumentationFlag::eMEMORY: Transfer memory usage data of our SDK.
Setup to transfer only profiling data over network:
pvd->connect(*transport, PxPvdInstrumentationFlag::ePROFILE);
Visualizing Externals and Extended Data
Joints are implemented as an extension to the SDK constraints and therefore need special handling to get transmitted to PVD. Both joint and contact data can increase the stream size significantly. Visualizing it in PVD is therefore disabled by default. To enable them use following API calls:
mScene->getScenePvdClient()->setScenePvdFlags(PxPvdSceneFlag::eTRANSMIT_CONSTRAINTS | PxPvdSceneFlag::eTRANSMIT_SCENEQUERIES | PxPvdSceneFlag::eTRANSMIT_CONTACTS);
or set the flags separately:
mScene->getScenePvdClient()->setScenePvdFlag(PxPvdSceneFlag::eTRANSMIT_CONSTRAINTS, true);
Visualizing SceneQuery
Visualizing SceneQuery in PVD is disabled by default since queries and hits data can increase the stream size significantly. To enable it use following API calls:
mScene->getScenePvdClient()->setScenePvdFlag(PxPvdSceneFlag::eTRANSMIT_SCENEQUERIES, true);
Custom PvdClient
Implement the PvdClient interface if your application needs to react upon connection or disconnection from PVD, or if you plan to send custom PVD events from your application. It is recommended to toggle the contact and constraint visualization in the onPvdConnected/onPvdDisconnected callbacks to avoid potential memory and compute overhead in the SDK:
// derive from PvdClient
struct MyPvdClient : public physx::pvdsdk::PvdClient
{
    virtual void onPvdConnected()
    {
        // 1. create a PvdDataStream
        // 2. send your custom PVD class descriptions from here
        // this then allows PVD to correctly identify and represent
        // custom data that is sent from your application to a PxVisualDebuggerConnection.
        // example in JointConnectionHandler
        // 3. do something when successfully connected
        // e.g. enable contact and constraint visualization
    }
    virtual void onPvdDisconnected()
    {
        // handle disconnection, release PvdDataStream
        // e.g. disable contact and constraint visualization
    }
    //impleament other methods
    ...
};

// register custom handler
MyPvdClient myPvdClient;
pvd->addClient(myPvdClient);
PVD Error Stream
PhysX SDK sends all its own error messages to PVD if PVD is connected. In addition, you can call Ps::Foundation::error() or Ps::Foundation::getErrorHandler()::reportError() to report your error message. These functions will send error messages to PVD automatically.
The messages will be listed in ErrorStream view of PVD.
Custom profiling
When using PxPvdInstrumentationFlag::ePROFILE, PVD internally calls PxSetProfilerCallback() to set itself up as the current profiler. This happens during the PxPvd::connect() call, and it overrides the potentially already existing profiler callback. That is, if users call PxSetProfilerCallback() with their own user profiler callback, and then initialize PVD with PxPvdInstrumentationFlag::ePROFILE, then the user profiler callback is lost. Similarly, initializing PVD first then calling PxSetProfilerCallback() will make PVD's profiling results vanish.
In case both PVD's internal profiling and a user's custom profiling are needed at the same time, it is recommended to initialize PVD first, then call PxSetProfilerCallback() with your own profiler. In your implementation, call the PVD profiling functions manually, before or after performing your own profiling operations:
struct UserProfilerCallback : public PxProfilerCallback
{
        PxPvd* mPvd;

        virtual void* zoneStart(const char* eventName, bool detached, uint64_t contextId)
        {
                // Do custom profiling here

                // Then re-route to PVD implementation
                return mPvd->zoneStart(eventName, detached, contextId);
        }
        virtual void zoneEnd(void* profilerData, const char* eventName, bool detached, uint64_t contextId)
        {
                // Do custom profiling here

                // Then re-route to PVD implementation
                mPvd->zoneEnd(profilerData, eventName, detached, contextId);
        }
};
This is illustrated in SnippetCustomProfiler.