About data access pages
A data access page is a special type of Web page that enables you to view and work with data from a database. It might also include data from other sources, such as Microsoft Excel. How you interact with the page depends on what it's used for.
This type of data access page is often used to consolidate and group information that is stored in the database, and to publish summaries of the data. For example, a page might publish the sales performance for each region in which you do business. Using expand indicators, you can go from a general summary of the information, such as a list of all the regions and their combined sales total, to specific details on individual sales within each region. The data access page might provide toolbar buttons for sorting and filtering the data, as well as for adding, editing, and deleting the data in some or all group levels.
This type of data access page may include a PivotTable list, similar to a Microsoft Access PivotTable form or Microsoft Excel PivotTable report, that lets you reorganize the data to analyze it in different ways. The page may contain a chart that you can use to analyze trends, detect patterns, and compare data in your database. Or it might contain a spreadsheet, in which you can enter and edit data and use formulas to calculate as you do in Excel.
A data access page is connected directly to a database. When you display the page in Microsoft Internet Explorer, you're viewing your own copy of the page. That means any filtering, sorting, and other changes you make to how the data is displayed — including changes you make within a PivotTable list or spreadsheet — affect only your copy of the data access page. However, changes that you make to the data itself — such as modifying values, and adding or deleting data — are stored in the underlying database, and therefore are available to everyone viewing the page.
Data access pages are supported in Microsoft Internet Explorer 5 or later.
Parts of a data access page
A data access page can have many features; however, these features vary depending on the purpose of the page. Some of the most common features are listed below. (Fields and records are always part of a data access page; however, how they are presented varies.)

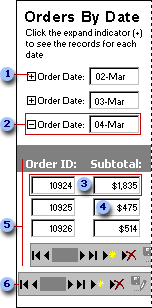
 Expand indicator
 Group header
 A record is a collection of related facts about one entity, such as a customer, a customer order, or an employee, stored in a database.
 A text box displays existing data from the underlying database, or, if allowed, accepts new data that you enter to be stored in the database.
 Group records for 04-Mar.
 The record navigation toolbar lets you quickly move between records or add, delete, save, undo changes to, sort, or filter records.
Groups organize data into sets. For example, the above page groups records of customers' orders by date. The name of each date is the group header. Depending on how the page was designed, either all the groups are displayed on the page (usually with their records hidden), or no specific group is displayed until you choose one from a list of available groups. If the page shows all groups, you can display the records for a specific group by clicking its expand indicator. Some or all groups in the page may support data entry.
In a grouped data access page, each group might have its own record navigation toolbar located at the bottom of the expanded group.
In addition to the above, a page might contain one or more of the following:
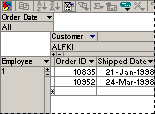
PivotTable lists are similar to Microsoft Excel PivotTable reports. They display data in a row and column format that you can reorganize to analyze data in different ways. You do this by moving rows to columns and columns to rows, displaying totals at the intersection of rows and columns, and otherwise rearranging and summarizing the data. A PivotTable list includes its own toolbar and built-in Help.

Spreadsheets are similar to Microsoft Excel worksheets. They allow you to enter and edit data or to calculate data. A spreadsheet includes its own toolbar and built-in Help.

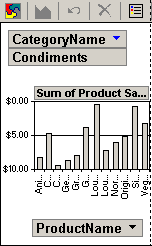
Charts use database data to visually display trends, patterns, and comparisons. When data in the database changes, the chart updates accordingly. If the chart is linked to a PivotTable list or spreadsheet on the data access page, the chart changes when you change the PivotTable list or spreadsheet.


 Interactive reporting