Sales By Department Report
From Amicus


| Amicus | |
| Sales By Department Report | |
| See Also Submit feedback on this topic | |
| Reports > Sales Reports > Sales By Department Report |
Glossary Item Box
The Sales By department Report lists total of items sold within a department on a department by department basis. The report also gives a graphical comparison of department to total value of the items sold and number of sales per department.
Click Reports on the Main Menu, followed by Sales Reports then Sales By Department Report option. Alternatively, click Sales on the Toolbar followed by Reports, Sales Reports then Sales By Department Report option.
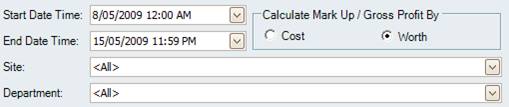
Figure : Sales By Department Report options
Options
Select the Start Date Time, End Date Time, Site and Department and the way the Mark Up and Gross Profit is calculated by, either cost or worth.
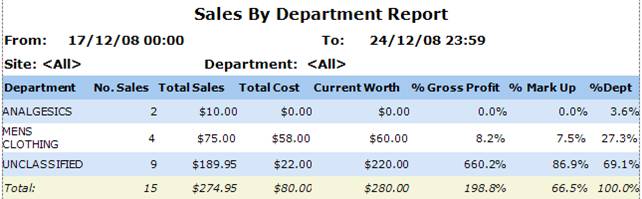
Figure : Sales By Department Report sample report - filters & table of figures
Filters
The filters listed on the report include; Start Date Time, End Date Time, Site and Department.
Details
The Sales are listed by; Department, No. Sales, Total Sales value, Total Cost and Current Worth of products sold, % Gross Profit and % Mark Up.
Graphs
In addition to the figures above the report includes graphical comparisons of the Value of Sales and Number of Sales made by each department represented in the form of bar charts.
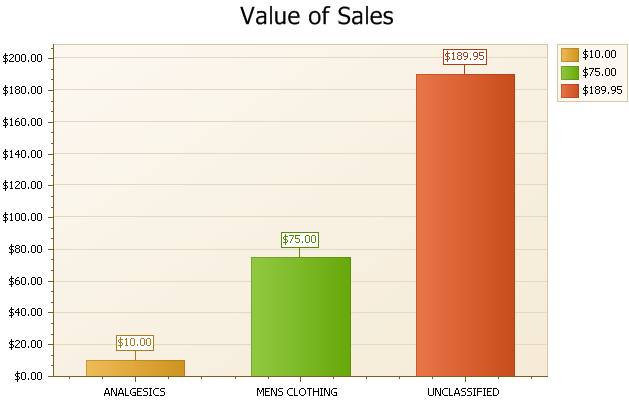
Figure : Sales By Department Report sample report - Value of Sales graph
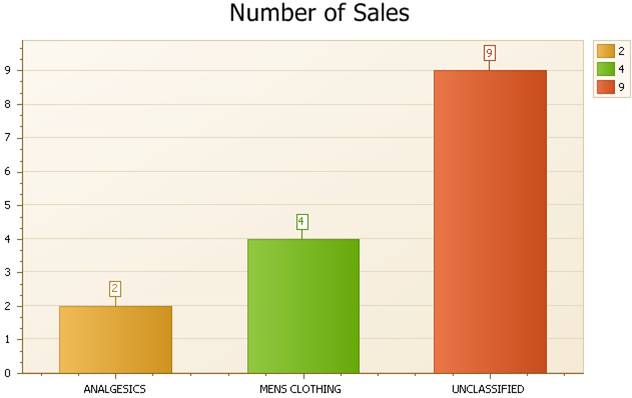
Figure : Sales By Department Report sample report - Number of Sales graph