设计自己的Trait编辑器
From Python Scientific Calculator
设计自己的Trait编辑器
在前面的章节中我们知道,每种trait属性都对应有缺省的trait编辑器,如果在View中不指定编辑器的话,将使用缺省的编辑器构成界面。每个编辑器都可以对应有多个后台,目前支持的后台界面库有pyQt和wxPython。每种编辑器都可以有四种样式:simple, custom, text, readonly。
traitsUI为我们提供了很丰富的编辑器库,以至于我们很少有自己设计编辑器的需求,然而如果我们能方便地设计自己的编辑器,将能制作出更加专业的程序界面。
本章节将简要介绍trait编辑器的工作原理;并且制作一个新的trait编辑器,用以显示matplotlib提供的绘图控件;然后以此控件制作一个通用的绘制CSV文件数据图像的小工具。
Trait编辑器的工作原理
我们先来看下面这个小程序,它定义了一个TestStrEditor类,其中有一个名为test的trait属性,其类型为Str,在view中用Item定义要在界面中显示test属性,但是没有指定它所使用的编辑器(通过editor参数)。当执行t.configure_traits()时,traits库将自动为我们挑选文本编辑框控件作为test属性的编辑器:
from enthought.traits.api import *
from enthought.traits.ui.api import *

class TestStrEditor(HasTraits):
    test = Str
    view = View(Item("test"))

t = TestStrEditor()
t.configure_traits()
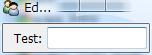
使用文本编辑框控件编辑test属性
Traits库的路径
下面的介绍需要查看traits库的源程序,因此首先你需要知道它们在哪里:
traits: site-packages\Traits-3.2.0-py2.6-win32.egg\enthought\traits, 以下简称 %traits%
traitsUI: site-packages\Traits-3.2.0-py2.6-win32.egg\enthought\traits\UI, 以下简称 %ui%
wx后台界面库: site-packages\TraitsBackendWX-3.2.0-py2.6.egg\enthought\traitsui\wx, 以下简称 %wx%
Str对象的缺省编辑器通过其create_editor方法获得:
>>> from enthought.traits.api import *
>>> s = Str()
>>> ed = s.create_editor()
>>> type(ed)
<class 'enthought.traits.ui.editors.text_editor.ToolkitEditorFactory'>
>>> ed.get()
{'auto_set': True,
 'custom_editor_class': <class 'enthought.traits.ui.wx.text_editor.CustomEditor'>,
 'enabled': True,
 'enter_set': False,
 'evaluate': <enthought.traits.ui.editors.text_editor._Identity object at 0x0427F1B0>,
 'evaluate_name': '',
 'format_func': None,
 'format_str': '',
 'invalid': '',
 'is_grid_cell': False,
 'mapping': {},
 'multi_line': True,
 'password': False,
 'readonly_editor_class': <class 'enthought.traits.ui.wx.text_editor.ReadonlyEditor'>,
 'simple_editor_class': <class 'enthought.traits.ui.wx.text_editor.SimpleEditor'>,
 'text_editor_class': <class 'enthought.traits.ui.wx.text_editor.SimpleEditor'>,
 'view': None}
create_editor方法的源代码可以在%traits%trait_types.py中的BaseStr类的定义中找到。create_editor方法得到的是一个text_editor.ToolkitEditorFactory类:
enthought.traits.ui.editors.text_editor.ToolkitEditorFactory
在%ui%editorstext_editor.py中你可以找到它的定义,它继承于EditorFactory类。EditorFactory类的代码在%ui%editor_factory.py中。EditorFactory类是Traits编辑器的核心,通过它和后台界面库联系起来。让我们来详细看看EditorFactory类中关于控件生成方面的代码:
class EditorFactory ( HasPrivateTraits ):
    # 下面四个属性描述四个类型的编辑器的类
    simple_editor_class = Property
    custom_editor_class = Property
    text_editor_class   = Property
    readonly_editor_class = Property

    # 用simple_editor_class创建实际的控件
    def simple_editor ( self, ui, object, name, description, parent ):
        return self.simple_editor_class( parent,
                                         factory     = self,
                                         ui          = ui,
                                         object      = object,
                                         name        = name,
                                         description = description )


    # 这是类的方法,它通过类的以及父类自动找到与其匹配的后台界面库中的控件类
    @classmethod
    def _get_toolkit_editor(cls, class_name):
        editor_factory_classes = [factory_class for factory_class in cls.mro()
                                  if issubclass(factory_class, EditorFactory)]
        for index in range(len( editor_factory_classes )):
            try:
                factory_class = editor_factory_classes[index]
                editor_file_name = os.path.basename(
                                sys.modules[factory_class.__module__].__file__)
                return toolkit_object(':'.join([editor_file_name.split('.')[0],
                                             class_name]), True)
            except Exception, e:
                if index == len(editor_factory_classes)-1:
                    raise e
        return None

    # simple_editor_class属性的get方法,获取属性值
    def _get_simple_editor_class(self):
        try:
            SimpleEditor = self._get_toolkit_editor('SimpleEditor')
        except:
            SimpleEditor = toolkit_object('editor_factory:SimpleEditor')
        return SimpleEditor
EditorFactory的对象有四个属性保存后台编辑器控件的类:simple_editor_class, custom_editor_class, text_editor_class, readonly_editor_class。例如前面例子中的ed对象的simple_editor_class为<class 'enthought.traits.ui.wx.text_editor.SimpleEditor'>,我们看到它用的是wx后台界面库中的text_editor中的SimpleEditor类,稍后我们将看看其内容。
EditorFactory是通过其类方法_get_toolkit_editor计算出所要用后台界面库中的类的。由于_get_toolkit_editor是类方法,它的第一个参数cls就是类本身。当调用text_editor.ToolkitEditorFactory._get_toolkit_editor()时,cls就是text_editor.ToolkitEditorFactory类。通过调用cls.mro获得cls以及其所有父类,然后一个一个地查找,从后台界面库中找到与之匹配的类,这个工作由toolkit_object函数完成。其源代码可以在%ui%toolkit.py中找到。
因为后台界面库中的类的组织结构和traits.ui是一样的,因此不需要额外的配置文件,只需要几个字符串替代操作就可以将traits.ui中的EditorFactory类和后台界面库中的实际的编辑器类联系起来。下图显示了traits.ui中的EditorFactory和后台界面库的关系。
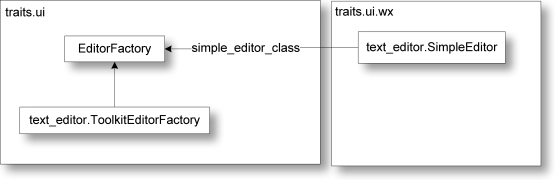
traits.ui中的EditorFactory和后台界面库的关系
wx后台界面库中定义了所有编辑器控件,在 %wx%text_editor.py 中你可以找到产生文本框控件的类 text_editor.SimpleEditor。类名表示了控件的样式:simple, custom, text, readonly,而其文件名(模块名)则表示了控件的类型。下面是 text_editor.SimpleEditor的部分代码:
class SimpleEditor ( Editor ):

    # Flag for window styles:
    base_style = 0

    # Background color when input is OK:
    ok_color = OKColor

    # Function used to evaluate textual user input:
    evaluate = evaluate_trait

    def init ( self, parent ):
        """ Finishes initializing the editor by creating the underlying toolkit
            widget.
        """
        factory       = self.factory
        style         = self.base_style
        self.evaluate = factory.evaluate
        self.sync_value( factory.evaluate_name, 'evaluate', 'from' )

        if (not factory.multi_line) or factory.password:
            style &= ~wx.TE_MULTILINE

        if factory.password:
            style |= wx.TE_PASSWORD

        multi_line = ((style & wx.TE_MULTILINE) != 0)
        if multi_line:
            self.scrollable = True

        if factory.enter_set and (not multi_line):
            control = wx.TextCtrl( parent, -1, self.str_value,
                                   style = style | wx.TE_PROCESS_ENTER )
            wx.EVT_TEXT_ENTER( parent, control.GetId(), self.update_object )
        else:
            control = wx.TextCtrl( parent, -1, self.str_value, style = style )

        wx.EVT_KILL_FOCUS( control, self.update_object )

        if factory.auto_set:
            wx.EVT_TEXT( parent, control.GetId(), self.update_object )

        self.control = control
        self.set_tooltip()
真正产生控件的程序是在init方法中,此方法在产生界面时自动被调用,注意方法名是init,不要和对象初始化方法__init__搞混淆了。
制作matplotlib的编辑器
Enthought的官方绘图库是采用Chaco,不过如果你对matplotlib库更加熟悉的话,将matplotlib的绘图控件嵌入TraitsUI界面中将是非常有用的。下面先来看一下嵌入matplotlib控件的完整源代码:
# -*- coding: utf-8 -*-
# file name: mpl_figure_editor.py
import wx
import matplotlib
# matplotlib采用WXAgg为后台,这样才能将绘图控件嵌入以wx为后台界面库的traitsUI窗口中
matplotlib.use("WXAgg")
from matplotlib.backends.backend_wxagg import FigureCanvasWxAgg as FigureCanvas
from matplotlib.backends.backend_wx import NavigationToolbar2Wx
from enthought.traits.ui.wx.editor import Editor
from enthought.traits.ui.basic_editor_factory import BasicEditorFactory

class _MPLFigureEditor(Editor):
    """
    相当于wx后台界面库中的编辑器,它负责创建真正的控件
    """
    scrollable = True

    def init(self, parent):
        self.control = self._create_canvas(parent)
        self.set_tooltip()
        print dir(self.item)

    def update_editor(self):
        pass

    def _create_canvas(self, parent):
        """
        创建一个Panel, 布局采用垂直排列的BoxSizer, panel中中添加
        FigureCanvas, NavigationToolbar2Wx, StaticText三个控件
        FigureCanvas的鼠标移动事件调用mousemoved函数,在StaticText
        显示鼠标所在的数据坐标
        """
        panel = wx.Panel(parent, -1, style=wx.CLIP_CHILDREN)
        def mousemoved(event):
            panel.info.SetLabel("%s, %s" % (event.xdata, event.ydata))
        panel.mousemoved = mousemoved
        sizer = wx.BoxSizer(wx.VERTICAL)
        panel.SetSizer(sizer)
        mpl_control = FigureCanvas(panel, -1, self.value)
        mpl_control.mpl_connect("motion_notify_event", mousemoved)
        toolbar = NavigationToolbar2Wx(mpl_control)
        sizer.Add(mpl_control, 1, wx.LEFT | wx.TOP | wx.GROW)
        sizer.Add(toolbar, 0, wx.EXPAND|wx.RIGHT)
        panel.info = wx.StaticText(parent, -1)
        sizer.Add(panel.info)

        self.value.canvas.SetMinSize((10,10))
        return panel

class MPLFigureEditor(BasicEditorFactory):
    """
    相当于traits.ui中的EditorFactory,它返回真正创建控件的类
    """
    klass = _MPLFigureEditor

if __name__ == "__main__":
    from matplotlib.figure import Figure
    from enthought.traits.api import HasTraits, Instance
    from enthought.traits.ui.api import View, Item
    from numpy import sin, cos, linspace, pi

    class Test(HasTraits):
        figure = Instance(Figure, ())
        view = View(
            Item("figure", editor=MPLFigureEditor(), show_label=False),
            width = 400,
            height = 300,
            resizable = True)
        def __init__(self):
            super(Test, self).__init__()
            axes = self.figure.add_subplot(111)
            t = linspace(0, 2*pi, 200)
            axes.plot(sin(t))

    Test().configure_traits()
此程序的运行结果如下:
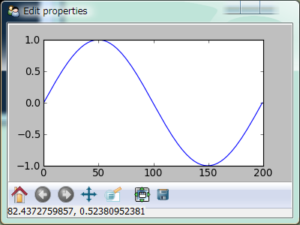
在TraitsUI界面中嵌入的matplotlib绘图控件
由于我们的编辑器没有simple等四种样式,也不会放到wx后台界面库的模块中,因此不能采用上节所介绍的自动查找编辑器类的办法。traits.ui为我们提供一个一个方便的类来完成这些操作:BasicEditorFactory。它的源程序可以在 %ui%basic_editor_factory.py中找到。下面是其中的一部分:
class BasicEditorFactory ( EditorFactory ):
    klass = Any

    def _get_simple_editor_class ( self ):
        return self.klass
    ...
它通过重载EditorFactory中的simple_editor_class属性,直接返回创建控件的库klass。MPLFigureEditor继承于BasicEditorFactory,指定创建控件的类为_MPLFigureEditor。
和text_editor.SimpleEditor一样,从Editor类继承,在_MPLFigureEditor类的init方法中,创建实际的控件。因为Editor类中有一个update_editor方法,在其对应的trait属性改变是会被调用,而我们的绘图控件不需要这个功能,所以重载update_editor,让它不做任何事情。
matplotlib中,在创建FigureCanvas时需要指定与其对应的Figure对象:
mpl_control = FigureCanvas(panel, -1, self.value)
这里self.value就是这个Figure对象,它在MVC的模型类Test中被定义为:
figure = Instance(Figure, ())
控件类可以通过self.value获得与其对应的模型类中的对象。因此_MPLFigureEditor中的self.value和Test类中的self.figure是同一个对象。
_create_canvas方法中的程序编写和在一个标准的wx窗口中添加控件是一样的,界面库相关的细节不是本书的重点,因此不再详细解释了。读者可以参照matplotlib和wxPython的相应文档。
CSV数据绘图工具
下面用前面介绍的matplotlib编辑器制作一个CSV数据绘图工具。用此工具打开一个CSV数据文档之后,可以绘制多个X-Y坐标图。用户可以自由地添加新的坐标图,修改坐标图的标题,选择坐标图的X轴和Y轴的数据。
下面是此程序的界面截图:
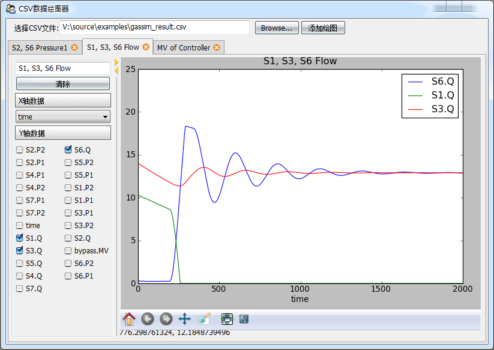
CSV数据绘图工具的界面
图中以标签页的形式显示多个绘图,用户可以从左侧的数据选择栏中选择X轴和Y轴的数据。标签页可以自由的拖动,构成上下左右分栏,并且可以隐藏左侧的数据选择栏:
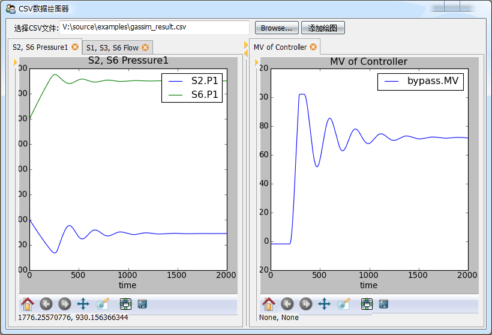
使用可调整DOCK的多标签页界面方便用户对比数据
由于绘图控件是matplotlib所提供的,因此平移、缩放、保存文件等功能也一应俱全。由于所有的界面都是采用TraitsUI设计的,因此主窗口既可以用来单独显示,也可以嵌入到一个更大的界面中,运用十分灵活。
下面是完整的源程序,运行时需要和mpl_figure_editor.py放在一个文件夹下。包括注释程序一共约170行,编写时间少于一小时。
1 2 3 4 5 6 7 8 9 10 11 12 13 14 15 16 17 18 19 20 21 22 23 24 25 26 27 28 29 30 31 32 33 34 35 36 37 38 39 40 41 42 43 44 45 46 47 48 49 50 51 52 53 54 55 56 57 58 59 60 61 62 63 64 65 66 67 68 69 70 71 72 73 74 75 76 77 78 79 80 81 82 83 84 85 86 87 88 89 90 91 92 93 94 95 96 97 98 99 100 101 102 103 104 105 106 107 108 109 110 111 112 113 114 115 116 117 118 119 120 121 122 123 124 125 126 127 128 129 130 131 132 133 134 135 136 137 138 139 140 141 142 143 144 145 146 147 148 149 150 151 152 153 154 155 156 157 158 159 160 161 162 163 164 165 166 167 168 169 170 171 | # -*- coding: utf-8 -*-
from matplotlib.figure import Figure
from mpl_figure_editor import MPLFigureEditor
from enthought.traits.ui.api import *
from enthought.traits.api import *
import csv
class DataSource(HasTraits):
"""
数据源,data是一个字典,将字符串映射到列表
names是data中的所有字符串的列表
"""
data = DictStrAny
names = List(Str)
def load_csv(self, filename):
"""
从CSV文件读入数据,更新data和names属性
"""
f = file(filename)
reader = csv.DictReader(f)
self.names = reader.fieldnames
for field in reader.fieldnames:
self.data[field] = []
for line in reader:
for k, v in line.iteritems():
self.data[k].append(float(v))
f.close()
class Graph(HasTraits):
"""
绘图组件,包括左边的数据选择控件和右边的绘图控件
"""
name = Str # 绘图名,显示在标签页标题和绘图标题中
data_source = Instance(DataSource) # 保存数据的数据源
figure = Instance(Figure) # 控制绘图控件的Figure对象
selected_xaxis = Str # X轴所用的数据名
selected_items = List # Y轴所用的数据列表
clear_button = Button(u"清除") # 快速清除Y轴的所有选择的数据
view = View(
HSplit( # HSplit分为左右两个区域,中间有可调节宽度比例的调节手柄
# 左边为一个组
VGroup(
Item("name"), # 绘图名编辑框
Item("clear_button"), # 清除按钮
Heading(u"X轴数据"), # 静态文本
# X轴选择器,用EnumEditor编辑器,即ComboBox控件,控件中的候选数据从
# data_source的names属性得到
Item("selected_xaxis", editor=
EnumEditor(name="object.data_source.names", format_str=u"%s")),
Heading(u"Y轴数据"), # 静态文本
# Y轴选择器,由于Y轴可以多选,因此用CheckBox列表编辑,按两列显示
Item("selected_items", style="custom",
editor=CheckListEditor(name="object.data_source.names",
cols=2, format_str=u"%s")),
show_border = True, # 显示组的边框
scrollable = True, # 组中的控件过多时,采用滚动条
show_labels = False # 组中的所有控件都不显示标签
),
# 右边绘图控件
Item("figure", editor=MPLFigureEditor(), show_label=False, width=600)
)
)
def _name_changed(self):
"""
当绘图名发生变化时,更新绘图的标题
"""
axe = self.figure.axes[0]
axe.set_title(self.name)
self.figure.canvas.draw()
def _clear_button_fired(self):
"""
清除按钮的事件处理
"""
self.selected_items = []
self.update()
def _figure_default(self):
"""
figure属性的缺省值,直接创建一个Figure对象
"""
figure = Figure()
figure.add_axes([0.05, 0.1, 0.9, 0.85]) #添加绘图区域,四周留有边距
return figure
def _selected_items_changed(self):
"""
Y轴数据选择更新
"""
self.update()
def _selected_xaxis_changed(self):
"""
X轴数据选择更新
"""
self.update()
def update(self):
"""
重新绘制所有的曲线
"""
axe = self.figure.axes[0]
axe.clear()
try:
xdata = self.data_source.data[self.selected_xaxis]
except:
return
for field in self.selected_items:
axe.plot(xdata, self.data_source.data[field], label=field)
axe.set_xlabel(self.selected_xaxis)
axe.set_title(self.name)
axe.legend()
self.figure.canvas.draw()
class CSVGrapher(HasTraits):
"""
主界面包括绘图列表,数据源,文件选择器和添加绘图按钮
"""
graph_list = List(Instance(Graph)) # 绘图列表
data_source = Instance(DataSource) # 数据源
csv_file_name = File(filter=[u"*.csv"]) # 文件选择
add_graph_button = Button(u"添加绘图") # 添加绘图按钮
view = View(
# 整个窗口分为上下两个部分
VGroup(
# 上部分横向放置控件,因此用HGroup
HGroup(
# 文件选择控件
Item("csv_file_name", label=u"选择CSV文件", width=400),
# 添加绘图按钮
Item("add_graph_button", show_label=False)
),
# 下部分是绘图列表,采用ListEditor编辑器显示
Item("graph_list", style="custom", show_label=False,
editor=ListEditor(
use_notebook=True, # 是用多标签页格式显示
deletable=True, # 可以删除标签页
dock_style="tab", # 标签dock样式
page_name=".name") # 标题页的文本使用Graph对象的name属性
)
),
resizable = True,
height = 0.8,
width = 0.8,
title = u"CSV数据绘图器"
)
def _csv_file_name_changed(self):
"""
打开新文件时的处理,根据文件创建一个DataSource
"""
self.data_source = DataSource()
self.data_source.load_csv(self.csv_file_name)
del self.graph_list[:]
def _add_graph_button_changed(self):
"""
添加绘图按钮的事件处理
"""
if self.data_source != None:
self.graph_list.append( Graph(data_source = self.data_source) )
if __name__ == "__main__":
csv_grapher = CSVGrapher()
csv_grapher.configure_traits()
|
程序中已经有比较详细的注释,这里就不再重复。如果你对traits库的某项用法还不太了解的话,可以直接查看其源代码,代码中都有详细的注释。下面是几个比较重点的部分:
整个程序的界面处理都只是组装View对象,看不到任何关于控件操作的代码,因此大大地节省了程序的开发时间。
通过配置141行的ListEditor,使其用标签页的方式显示graph_list中的每个元素,以此管理多个Graph对象。
在43行中,Graph类用HSplit将其数据选择部分和绘图控件部分分开,HSplit提供的更改左右部分的比例和隐藏的功能。
本书写作时所采用的traitsUI库版本为3.2,如果在标签页标题中输入中文,会出现错误,这是因为TraitsUI中还有些代码对unicode的支持不够,希望日后会有所改善。目前可以通过分析错误提示信息,修改TraitsUI库的源代码,只需要将下面提示中的770行中的str改为unicode既可以修复。
File "C:\Python26\lib\site-packages\traitsbackendwx-3.2.0-py2.6.egg\enthought\
traits\ui\wx\list_editor.py", line 770, in _create_page
name = str( name ) or '???'
UnicodeEncodeError: 'ascii' codec can't encode characters in position 0-1:
ordinal not in range(128)
matplotlib的绘图中是可以使用中文的,但是由于缺省字体不是中文字体,因此中文都变为方块,你可以按照 让Matplotlib显示中文 中所述修改matplotlib的字体。