Unknown
From Matlab plt
A Julia set explorer ( julia.m) version 01-Jan-17
Author: Paul MennenEmail: paul@mennen.org
Introduction
Julia set images are traditionally generated by repeated application of the equationIt's easy to find dozens of Julia set graphing programs in nearly every language (including Matlab), so I wouldn't fault you if you were skeptical of the need for yet another application with this purpose. However my goal was to show how fun it is to explore Julia sets and to make this application more compelling than any similar application out there. I'll let you be the judge of how well I have met this challenge.
Program initialization
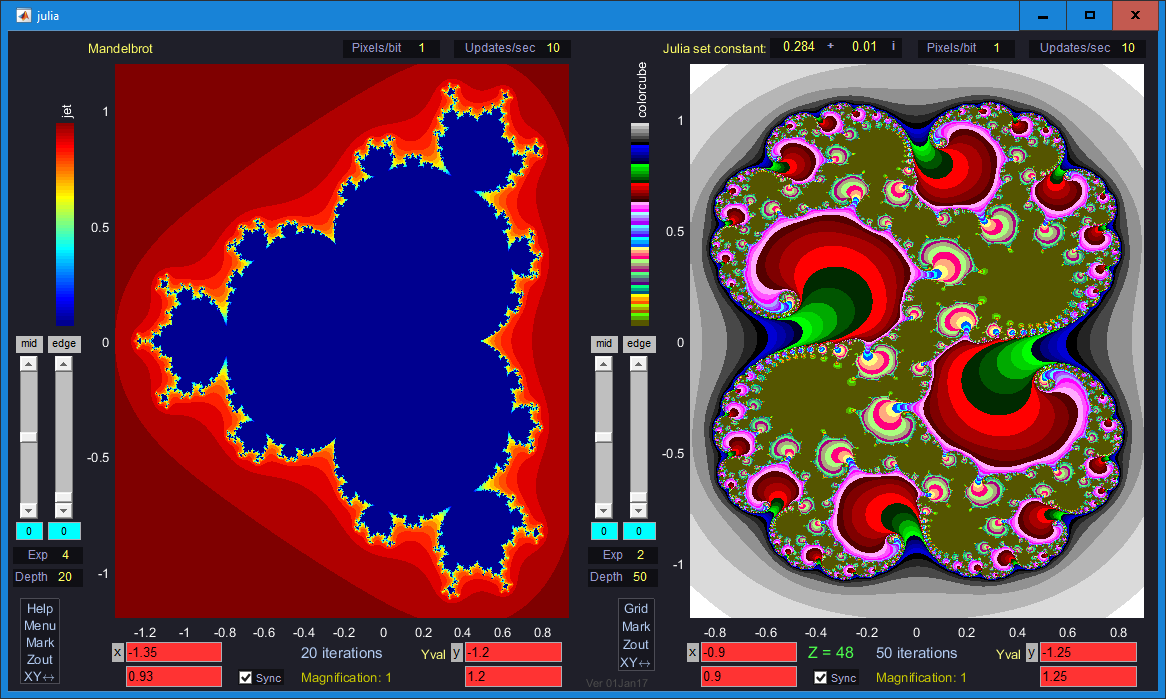 When julia.m starts, it creates two images which we refer to as the left and right images
(or sometimes the "opposite" image to refer to the right image when we are editing the left
and vice versa). Initially both images show the traditional Mandelbrot set (i.e.
with the exponent equal to two). The images will look identical (i.e. the same axis limits,
the same color map, the same color depth, and the same resolution), however after taking any
action, the two images will no longer be the same as in the screen capture shown here.
There is nothing special about the left or right image. Any action we can take on the right
image can also be taken on the left. However you will soon see the benefits of having two
images to play with.
(Click on this screen capture to view it in its full resolution.)
When julia.m starts, it creates two images which we refer to as the left and right images
(or sometimes the "opposite" image to refer to the right image when we are editing the left
and vice versa). Initially both images show the traditional Mandelbrot set (i.e.
with the exponent equal to two). The images will look identical (i.e. the same axis limits,
the same color map, the same color depth, and the same resolution), however after taking any
action, the two images will no longer be the same as in the screen capture shown here.
There is nothing special about the left or right image. Any action we can take on the right
image can also be taken on the left. However you will soon see the benefits of having two
images to play with.
(Click on this screen capture to view it in its full resolution.)
The Julia set exponent
There are two controls related to selecting the Julia set. The first control, labeled "exp", is located near the lower left corner of each image and determines the exponent (e) used in the recurrence relationThe Julia set constant
The second control related to selecting the Julia set is a popup menu located near the upper left corner of each image (which initially appears as the yellow label "Mandelbrot"). Assuming the exponent is at its default value (2), this is the popup that will appear when you click on that label. For the first selection of the popup (Mandelbrot) z is initialized to zero and c is chosen to correspond to the position we are determining the color for. For the remaining selections (Julia sets), z is initialized to the value corresponding to the pixel we are determining the color for, and then the recurrence relation is computed using one of the 14 constants shown in this popup menu. These 14 constants were chosen somewhat haphazardly although with the goal of creating interesting images. After one of the constants is chosen, the real and complex components of the constant are placed in edit pseudo objects so they may be modified easily. The default autoincrement amount is set to .01 but this may be modified by entering an increment value as described above. And as before, Julia set animations may be created by holding down the mouse to slide the real or imaginary components of the constant around the Julia set landscape while looking for interesting territory. If you change the Julia set exponent from 2 to any other value, the list of constants in the popup menu shrink from 14 to 4. (This is to simplify the task of placing the constants in interesting territory.) Notice that the four choices given continue to change as you change the exponent. They change in an attempt to remain in interesting territory and this generally is successful for relatively small (i.e. less than 10) whole number exponents. This is also at least somewhat successful for small fractional exponents. Instead of opening up the Julia set constant popup with a left click, you will probably find it more convenient to use the right mouse button instead. This will scroll thru the various Julia set constants (updating the image and the edit boxes for the real and imaginary parts of the constant) without having to open up the pseudo popup menu. After the last constant in the menu is selected, the next right click will cycle you back to the Mandelbrot set.Zooming the image
To appreciate the beauty and complexity of Julia sets you need to zoom into ever smaller regions of the set. The flexible and intuitive zoom features of this application are what makes it fun to use and set it apart from the many dozens of Julia set graphing programs you can find. There are many ways to zoom an image (see the Zooming and panning section), but the easiest method for this application is to double click the mouse while holding the mouse button down after the 2nd click. Then drag the mouse while continuing to hold down the mouse button. As you do this, a zoom box will be drawn - expanding in size as you drag the mouse. Even during this zoom box drawing operation, the opposite image will display the portion of the data inside the zoom box, behaving much like a magnifying glass. The smaller the zoom box, the higher the magnification and the more pixilated the image will appear. However once you let go of the mouse button, the magnified region is recomputed to the currently specified resolution (1 bit per pixel by default) at which point you will be able to see details in the image that were not visible before. If you find the double click and drag method awkward, you might try clicking both mouse buttons at the same time and holding them down while you drag. (My testing indicates that this works when you are using Matlab version 2014a or any earlier version, but not in more recent versions.) If you don't mind using the keyboard for this, another method requiring less dexterity is to hold the keyboard shift button down while dragging the mouse from the first corner to the opposite corner of the zoom box. (No double clicking required). This method works with all versions of Matlab.Moving the zoom box
You can change the zoom box using one or more of these methods:- Reposition the zoom box (without changing its size) by grabbing the midpoint of any one of the four zoom box edges and dragging it with the mouse. Note that as you drag the image on the opposite side will again behave like a moving magnifying glass, with a pixelated image. The magnified image will be recomputed (thus removing undesired pixelated effects) as soon as you release the mouse button after the repositioning operation.
- Resize the zoom box by grabbing any one of the four zoom box corners. Again, as mentioned above, the magnified area recomputes as soon as you release the mouse button after the resize operation.
- If you want the any of the zoom box coordinates to be a particular exact value simply type it into one of the edit boxes below the graph (xmin/xmax on the left and ymin/ymax on the right). As soon as you hit "enter" after typing a new value, the position of the corresponding edge of the zoom box will change to reflect the new entry and the opposite image will update (with full resolution) to show the area associated with the new zoom box region. If you want to enter all four zoom box coordinates, it is easiest to start with the xmin value because after entering the xmin value you can use tab (instead of enter) to enter the new value and proceed to the xmax value (then ymin, then ymax) without having to interrupt your typing to select the next edit box.
Magnification
Usually after the zoom window is drawn and you see the full detail in the magnified region you see something in the magnified region that you want to see in yet more detail. Use the same method to draw a zoom box again. In this manner you can bounce back and forth between the left and right images, getting higher and higher magnifications on smaller regions of the Julia set. Notice that below the plot, the magnification is shown compared with the original scaling (i.e. when the Julia set was first plotted). In the example shown here, the magnification is 4.09e7 which means that the area being displayed is 40 million times smaller than the original image. The edit boxes on the left show that the x values shown in the displayed region are between .31787 and .31825 (approximately). More digits are displayed than typical for these edit boxes because of the extreme magnification often used for plotting Julia sets. Similarly the y axis limits are shown in the two right hand edit boxes. Right below the plot, the number of times the recurrence relation was computed to generate the image is shown (289 iterations in this example). You will notice that as you zoom in to higher magnifications, more iterations are computed since this is necessary to achieve the same detail level. The magnification readout can also be used as a zoom control. Simply left-click on it to zoom out by a factor of 100 (in area), or zoom out all the way to the original axis limits by right-clicking instead. You can also experiment with panning the image (just click and drag the mouse inside the image) or do that with the right mouse button instead to Zoom in or out (without using a zoom box). Left or right-clicking the Zout tag will zoom out or in by a small amount (doubling or halving the area), although usually you will find you want the large zoom factors available with the other methods.The sync check box
The method described above for zooming to higher and higher magnifications (by alternating between the left and right images) is probably the easiest way; however, you may want to zoom into a region on one image without changing the image on the opposite side. For instance you may be interested in comparing two different regions of a Julia set or comparing the same region of two different Julia sets. In such situations you should uncheck the sync checkbox (just to the left of the "Magnification: 4.09e7" indicator in the above screen capture). This changes the plot from the "automatic sync" mode to the "manual sync" mode. To prevent automatic synchronization in both directions, you must uncheck the sync checkbox under both image plots.Once in manual sync mode, after drawing a zoom box you will see no changes to the image right away except for the existence of the zoom box. You can follow the drawing of a zoom box with one or more of these actions:
- Reposition or resize the zoom box by any of the three methods mentioned above.
- Left-click anywhere in the plot area (not near the zoom box) to expand the plot to so that it shows just the region inside the zoom box. The Julia set will be recomputed to match the requested resolution.
- Right-click anywhere in the plot area to cancel the zoom operation (and remove the zoom box from the display).
The pixels/bit parameter and the depth parameter
When you are using the edit box auto-increment feature to cycle thru small changes in the Julia set exponent or the Julia set constant a fast update rate is essential to finding interesting regions of the Julia sets. The update rate is probably going to be too slow for this purpose when using the default settings, however there are three things you can do to speed this up. The first is to make the figure window smaller. You may have already tried expanding the figure to full screen mode, and indeed this does produce large images with great detail. However the update rate will be slower since it increases proportionally with the number of pixels. Shrinking the figure will conversely speed up the update rate, although if you shrink the figure too much, the controls will become too small to use easily.The second way you can speed up the update rate is to reduce the number of times the recursion formula is executed. This is done using the depth parameter which can be changed using the edit box just above the menubox near the lower left corner of each image. When you select a new Julia set (by changing the Julia set exponent or constant) a default depth (usually 50) is chosen which produces a pleasing image for that particular set. Try setting the depth to 5 and notice that the display updates 10 times faster. Then notice as you click the mouse on the different colors of the image the Z value (which appears just above the sync checkbox) will range from zero to five and the image will include no more than six colors. Z=0 indicates that the recurrence relation never exceeded a magnitude of 2, and Z=5 indicates that the recurrence relation exceeded a magnitude of 2 on the 5th iteration. The number of iterations only matches the depth setting when the magnification is equal to one. As you zoom in, the iterations automatically increase. (The number of iterations doubles every time the magnification is increased by a factor of 1000.)
The last (and strongest) influence you can make on the update rate is the pixels/bit setting. The default setting is "one" indicating that the color for each pixel of the image is determined independently. Thus for a 500 by 500 pixel image the recurrence relation must be repeated 250 thousand times for each iteration. However if you change the pixels/bit setting (just above the image) to 3 (for example) you reduce the computations by a factor of 9 since each 3x3 block of pixels will be assigned the same color. The resulting blocky image is not as pleasing, but it is still fine for finding the interesting regions where you want to focus your interest. You can use higher settings (lower resolutions) as well, but 3 is probably as high as you will need to go to get acceptable update rates. In fact a setting of 2 will often be sufficiently fast as well.
The color map selectors
If you click on one of the vertical color bars to the left of each image, a new mapping between the Z values and the image colors will be selected. There are 10 different color maps and after selecting the 10th one, clicking again will select the first one again. Also right-clicking will cycle thru the color maps in the reverse order. Most of the color maps are designed to make it easy for you to see the general shape of the surface contour (i.e. high vs low areas) based on the image color. However two of the color maps (colorcube and lines) are designed to allow you to see as many level transitions as possible, and the general shape of the contour is difficult to discern (and in fact impossible with the lines color map). Clicking on the color bar next to the left image only changes the color map for that image, so this makes it easy to compare two identical Julia sets colored with different maps. However if you are using a version of Matlab older than version 2014b you will find that changing the left color map automatically changes the right color map (and vice versa). This is because those versions only allow one color map at a time to be associated with any figure window.Initial help text
When this application first starts, some very basic help text appears in the left image (white characters). Although it can't really substitute for the full help information in this document, it may be enough to get you started. As soon as you click in the plot area or make any changes to the fractal parameters, the help text disappears so it doesn't interfere with viewing the fractals.Paul Mennen