Data editing
From Matlab plt

Data editing
plt has the capability to modify the plotted data, either one point at a time or over a specified range. Data entry is accomplished by entering the coordinates via the keyboard or by using the mouse when keyboard accuracy is not required. (An alternate method of data editing appropriate for short data sequences is described in the Menu box section.)
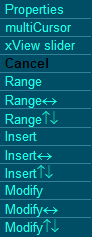
The first step is to click on the trace containing the data that you wish to edit. The second step is to right-click on the Ycursor edit box. (This is the edit box closest to the lower right corner of the figure.) When you do that, a popup menu will appear with the list of 13 choices shown here. The first three items in this menu, don't really have anything to do with data editing, but this was a convenient place to put them. When you select the first menu item (Properties) one of three different property editing windows will appear depending on how it is selected. When you left-click on "Properties" a window appears which allows you to modify the color and other properties of the currently selected line and its cursor. If before clicking on "Properties" you enable delta cursor mode (Δ button) then a property windows appears which allows you to edit all the lines at once. This is often appropriate for the color property, but it also may be useful for some of the other trace properties, such as linewidth. And finally, if instead of left-clicking you right-click on "Properties" then a window appears that allows you to edit the figure colors. This is the easiest method of accessing the three property editing windows, although for historical reasons there are two additional ways of opening these windows. One is via the "Colors/Lines" selection of the menu bar and the other is via right-clicking the "Mark" tag in the menu box. Both of these methods are mentioned in the Menu box section which also has a full description of the three different property editing windows and how to use them.
The second menu choice (multiCursor) toggles the multiCursor mode which is described here in the Cursoring section and third menu choice (xView slider) toggles the xView slider which is described here in the Zooming and panning section
The fourth menu choice (Cancel) is useful if you opened this popup menu accidentally or when you want to abort an already initiated data editing operation.
The remaining nine selections in this popup contain the actual data editing commands. The descriptions below are written for completeness rather than brevity so don't be scared off. The commands are intuitive, so you may be better off skipping the descriptions at first in favor of experimentation. The nine editing commands are divided into these three types:
| The modify commands change the x or y (or both) coordinates of a single data point. When using these commands, the length of the x and y vectors do not change. | |
| The insert commands add a new xy data pair to the data at the current cursor point. When using these data editing commands, the length of the x and y vectors increase by one. The one exception to that is that when you attempt to add a new data pair with its y value less than the current minimum y-axis limit, then the data at the current cursor point is removed from the data set (i.e. the length of the x and y vectors decrease by one). | |
| With the range commands (as with modify) the length of the x and y vectors remain the same. However in this case more than one data point is changed. All the data points between the current cursor location and the location modified during the previous data editing command are modified so that all these points lie on a straight line connecting the two end locations. For this to work, the previously edited point and the current cursor location must both lie on the same line. If this is not true, then the Range commands behave just like the Modify commands described above, and you will know happened because the cursor shape will be consistent with a Modify command. (See cursor shapes table below). |
The nine commands are also categorized into three modes identified by the arrows next to each command as follows:
Insert↑↓ Range↑↓ |
These are the three most commonly used data editing modes. As soon as you select the editing mode, the regular data cursor disappears and is replaced by an editing cursor with a different shape. (See data editing cursor shapes below). Then you can grab the edit cursor with the mouse and drag it to the desired location. However you will only be able to move the cursor up and down (i.e. only the y coordinate is allowed to change). Normally as soon as you release the mouse button (after the edit cursor has been dragged to its new location) the edit command will take effect, the edit cursor will disappear, and the normal data cursor will reappear. However if instead of using the normal left mouse button, you drag the edit cursor using the right mouse button, then when you release the mouse the edit command will take effect but the edit cursor will remain active. This makes it easier to see the effect of the edit and easily re-adjust if necessary. Once you are satisfied with the edit command you can regain the normal data cursor mode by selecting "Cancel" (the second popup option mentioned above) or more quickly just by clicking anywhere in the plot area other than the edit cursor itself. In addition to moving the edit cursor with the mouse, you can also move the edit cursor more precisely by typing a new y value into the Ycursor edit box. (You can also modify the x coordinate by typing a new x value into the Xcursor edit box despite the fact that you can't change the x value when using the mouse.) After you type a value into either the x or y cursor edit box, the edit command takes effect and the data edit mode is immediately canceled and the original data cursor is restored (i.e. there is no provision for a delayed exit from edit mode like you get using the right mouse button). If you would rather stay in edit mode until cancelled explicitly, just use one of the three commands without any arrows after it (described below). |
Insert↔ Range↔ |
These three commands behave identically to the three commands described above except for the fact that with the mouse you can only drag the cursor left or right (i.e. only the x coordinate is allowed to change). |
Insert Range |
When using these three commands you can use the mouse to drag the edit cursor anywhere. As before the editing mode is cancelled as soon as you release the mouse button (unless you used the right mouse button). As mentioned above, the use of the X and Y cursor edit boxes is slightly different in that it stays in edit mode until you cancel it explicitly (usually by clicking anywhere in the plot area). |
The currently enabled cursor can be put into data editing mode from a program as well. For example the command
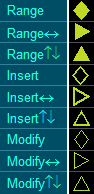
The usual data cursor is a plus sign or a small circle. Once you select one of the nine editing modes, the data cursor changes to one of the nine edit cursors shown in this figure. Although it wouldn't really be necessary to have a different cursor for each mode, it does help you remember what mode you are currently in. If you don't like the default size that plt chooses for the data edit cursors, you can change this with a command such as: setappdata(gcf,'CurEdit',14). The new size will be used the next time a cursor edit mode is selected.
If plt was called using the MotionEdit parameter, the function specified with that parameter will be called continuously as you drag the edit cursor around. This function may be used to create or modify text, plots or other gui objects on the screen. Both the editz.m and pltquiv.m examples demonstrate the use of the MotionEdit parameter. (Also see Mouse Motion Functions)
If you want to save the altered data (to a file for example) you have to get the data from the 'xdata' and 'ydata' properties of the line handle. (Remember the line handles are returned by the plt call.) When the user modifies any data using these data editing functions, plt executes the user specified move cursor callback. (See the description of the 'set','moveCB' function here.) The callback routine or any other part of your application can use the 'NewData' application property of the current figure window to determine if data has been modified by one of the data edit commands. For example:
index = getappdata(gcf,'NewData'); % returns the index where xdata/ydata was modified
if index % is there any new data?
DataWasModifiedAction(index); % yes, process the new data
setappdata(gcf,'NewData',0); % indicate that the data was already processed
end;
Note that the NewData property only gets set after a data edit operation is complete, unlike the MotionEdit function which gets called as you are dragging a cursored value to its new location. There is one additional figure application data variable called Dedit that may also be useful for an application using the data editing feature. The command getappdata(gcf,'Dedit') will return the following 9 element row vector:
| The CursorID associated with the edited trace | |
| A number from 1 to 9 which identifies which data edit command is being used. (This is starting from the top of the popup, so 1 indicates the "Range" selection and 9 indicates the "Modify↑↓" selection). | |
| The handle of the cursor object associated with the modified data. | |
| For internal use. (This saves the cursor marker shape, size, and linewidth so that the normal cursor can be restored when the data edit operation is complete.) | |
| For internal use. (This saves the position index and trace number of the previously edited trace - information is needed for the modify range operations.) | |
| The position index of the cursor into the edited trace |
After performing a data edit operation it is likely that you will want to perform another data edit using the same data edit command. Thus it would be nice if you could initiate another data edit operation without having to again select one of the nine data editing operations. In fact there is a way to do this - simply right-click on the Xcursor edit box. This behaves similarly to what happens when you right-click on the Ycursor edit box except you don't get the menu of data editing choices, since it will use your previous selection. There has to be a default for this operation in case the user right-clicks on the Xcursor edit box before doing any other data edit operation. The default is "Modify" since this is the most commonly used operation. It is rare to want to change this default, although it is not difficult to do so. In fact the demo\editz.m demo program changes this default, so refer to that example to see how it is done.