About statistical analysis tools
Microsoft Excel provides a set of data analysis tools — called the Analysis ToolPak — that you can use to save steps when you develop complex statistical or engineering analyses. You provide the data and parameters for each analysis; the tool uses the appropriate statistical or engineering macro functions and then displays the results in an output table. Some tools generate charts in addition to output tables.
Related worksheet functions Excel provides many other statistical, financial, and engineering worksheet functions. Some of the statistical functions are built-in and others become available when you install the Analysis ToolPak.
Accessing the data analysis tools The Analysis ToolPak includes the tools described below. To access these tools, click Data Analysis on the Tools menu. If the Data Analysis command is not available, you need to load the Analysis ToolPak add-in program.
The Anova analysis tools provide different types of variance analysis. The tool to use depends on the number of factors and the number of samples you have from the populations you want to test.
Anova: Single Factor This tool performs a simple analysis of variance, testing the hypothesis that means from two or more samples are equal (drawn from populations with the same mean). This technique expands on the tests for two means, such as the t-test.
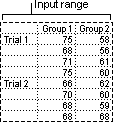
Anova: Two-Factor With Replication This analysis tool performs an extension of the single-factor anova that includes more than one sample for each group of data.

Anova: Two-Factor Without Replication This analysis tool performs a two-factor anova that does not include more than one sampling per group, testing the hypothesis that means from two or more samples are equal (drawn from populations with the same mean). This technique expands on tests for two means, such as the t-test.
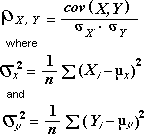
The Correlation analysis tool measures the relationship between two data sets that are scaled to be independent of the unit of measurement. The population correlation calculation returns the covariance of two data sets divided by the product of their standard deviations based on the following formulas.

You can use the correlation analysis tool to determine whether two ranges of data move together — that is, whether large values of one set are associated with large values of the other (positive correlation), whether small values of one set are associated with large values of the other (negative correlation), or whether values in both sets are unrelated (correlation near zero).
Note To return the correlation coefficient for two cell ranges, use the CORREL worksheet function.
Covariance is a measure of the relationship between two ranges of data. The Covariance analysis tool returns the average of the product of deviations of data points from their respective means, based on the following formula.

You can use the covariance tool to determine whether two ranges of data move together — that is, whether large values of one set are associated with large values of the other (positive covariance), whether small values of one set are associated with large values of the other (negative covariance), or whether values in both sets are unrelated (covariance near zero).
Note To return the covariance for individual data point pairs, use the COVAR worksheet function.
The Descriptive Statistics analysis tool generates a report of univariate statistics for data in the input range, providing information about the central tendency and variability of your data.
The Exponential Smoothing analysis tool predicts a value based on the forecast for the prior period, adjusted for the error in that prior forecast. The tool uses the smoothing constant a, the magnitude of which determines how strongly forecasts respond to errors in the prior forecast.

Note Values of 0.2 to 0.3 are reasonable smoothing constants. These values indicate that the current forecast should be adjusted 20 to 30 percent for error in the prior forecast. Larger constants yield a faster response but can produce erratic projections. Smaller constants can result in long lags for forecast values.
 F-Test Two-Sample for Variances
The F-Test Two-Sample for Variances analysis tool performs a two-sample F-test to compare two population variances.
For example, you can use an F-test to determine whether the time scores in a swimming meet have a difference in variance for samples from two teams.
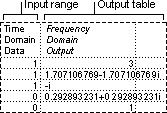
The Fourier Analysis tool solves problems in linear systems and analyzes periodic data by using the Fast Fourier Transform (FFT) method to transform data. This tool also supports inverse transformations, in which the inverse of transformed data returns the original data.

The Histogram analysis tool calculates individual and cumulative frequencies for a cell range of data and data bins. This tool generates data for the number of occurrences of a value in a data set.
For example, in a class of 20 students, you could determine the distribution of scores in letter-grade categories. A histogram table presents the letter-grade boundaries and the number of scores between the lowest bound and the current bound. The single most-frequent score is the mode of the data.
The Moving Average analysis tool projects values in the forecast period, based on the average value of the variable over a specific number of preceding periods. A moving average provides trend information that a simple average of all historical data would mask. Use this tool to forecast sales, inventory, or other trends. Each forecast value is based on the following formula.

where:
- N is the number of prior periods to include in the moving average
- Aj is the actual value at time j
- Fj is the forecasted value at time j
The Random Number Generation analysis tool fills a range with independent random numbers drawn from one of several distributions. You can characterize subjects in a population with a probability distribution.
For example, you might use a normal distribution to characterize the population of individuals' heights, or you might use a Bernoulli distribution of two possible outcomes to characterize the population of coin-flip results.
The Rank and Percentile analysis tool produces a table that contains the ordinal and percentage rank of each value in a data set. You can analyze the relative standing of values in a data set.
The Regression analysis tool performs linear regression analysis by using the "least squares" method to fit a line through a set of observations. You can analyze how a single dependent variable is affected by the values of one or more independent variables.
For example, you can analyze how an athlete's performance is affected by such factors as age, height, and weight. You can apportion shares in the performance measure to each of these three factors, based on a set of performance data, and then use the results to predict the performance of a new, untested athlete.
The Sampling analysis tool creates a sample from a population by treating the input range as a population. When the population is too large to process or chart, you can use a representative sample. You can also create a sample that contains only values from a particular part of a cycle if you believe that the input data is periodic.
For example, if the input range contains quarterly sales figures, sampling with a periodic rate of four places values from the same quarter in the output range.
The t-Test analysis tools test the means of different types of populations.
t-Test: Two-Sample Assuming Equal Variances This analysis tool performs a two-sample student's t-test. This t-test form assumes that the means of both data sets are equal; it is referred to as a homoscedastic t-test. You can use t-tests to determine whether two sample means are equal.
t-Test: Two-Sample Assuming Unequal Variances This analysis tool performs a two-sample student's t-test. This t-test form assumes that the variances of both ranges of data are unequal; it is referred to as a heteroscedastic t-test. You can use a t-test to determine whether two sample means are equal. Use this test when the groups under study are distinct. Use a paired test when there is one group before and after a treatment.
The following formula is used to determine the statistic value t.

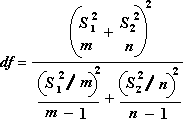
The following formula is used to approximate the degrees of freedom. Because the result of the calculation is usually not an integer, use the nearest integer to obtain a critical value from the t table.

t-Test: Paired Two Sample For Means This analysis tool and its formula perform a paired two-sample student's t-test to determine whether a sample's means are distinct. This t-test form does not assume that the variances of both populations are equal. You can use a paired test when there is a natural pairing of observations in the samples, such as when a sample group is tested twice — before and after an experiment.
Note Among the results generated by this tool is pooled variance, an accumulated measure of the spread of data about the mean, derived from the following formula.

The z-Test: Two Sample for Means analysis tool performs a two-sample z-test for means with known variances. This tool is used to test hypotheses about the difference between two population means.
For example, you can use this test to determine differences between the performances of two car models.
