Curve Fitting > Curve Fit Equations
The available curve fitting equations are listed in the table below.
|
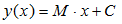
Straight line
|
|
|
Exponential (general)
|

|
|
Decaying Exp.
|

|
|
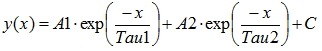
2 Exponential (general)
|
|
|
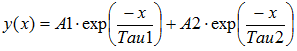
2 Decaying Exps.
|
|
|
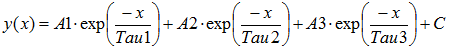
3 Exponential
|
|
|
3 Decaying Exps.
|

|
|
EPC
|

The endplate current rising phase is modelled by an error function and the decay with an exponential function.
|
|
EPC (2 exp)
|
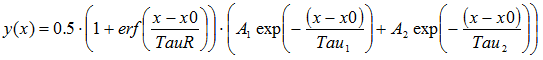
The endplate current rising phase is modelled by an error function and the decay by the sum of two exponential function.
|
|
H-H (K)
|
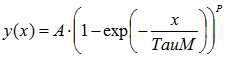
The time course of activation of a voltage-activated current with Hodgkin-Huxley kinetics
|
|
H-H (Na)
|

The time course of a current with voltage dependent activation and inactivation following Hodgkin-Huxley kinetics (e.g. sodium current). (Note. It is assumed that, initially, the activation parameter, m=0 and inactivation parameter, h=1.)
|