Manual |
Top Previous Next |
|
This program performs:
1. Fills the table with the results 2. Displays the graph 3. Saving to the file both data, and experience results, project settings 4. Downloading data and project settings from the file 5. Data output in Word 6. Data output in Excel 7. Presentation of the presentation 8. Running the calculator
Also, the project implemented a COM object.
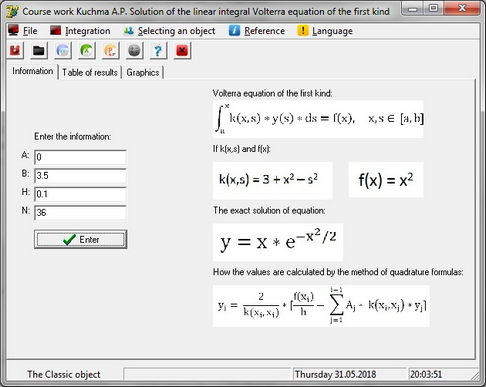
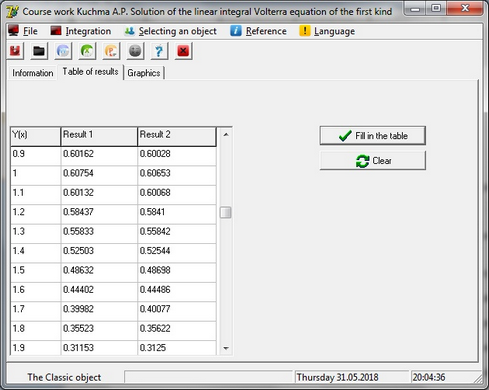
1. In order to fill the table, it is enough to take two steps: on the information tab fill the fields and press the Enter button; Then go to the tab of the table of results (table of results) and click the fill in the table button.
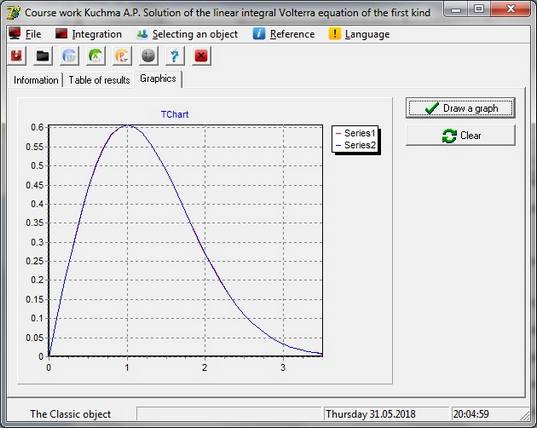
2. Display the graph. To do this, just go to the Graphics tab, select the right liquid on the right and click the Draw a graph button.
3. Save to the file as data, and the results of experience, project settings. To do this, you can click the button on the main form or go to the file menu -> save -> select the desired option to save.
4. Download. To do this, you can click the button on the main form or go to the file menu (file) -> download (load) -> select the desired option for download.
5. Output of data in Word. To do this, you can click the button on the form or go to the Integration menu -> In Word
6. Output of data to Excel. To do this, you can click the button on the form or go to the Integration menu -> In Excel
7. To display the presentation, you can click the button on the form or go to the menu Reference -> Presentation
8. Start the calculator. Run the button from the form or through the menu Reference -> Calculate |


