Quick Pivot
From Alchemex 7.1
Home > Custom Add-In for Excel > Quick Pivot
Quick Pivot
The user is able to create Pivot Tables from within existing reports as and when needed. The user is able to customize Pivot Tables without leaving an existing report pack.
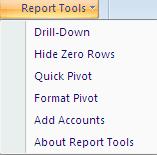
Within the applicable Microsoft Excel report generated from the Report Manager, access the Quick Pivot option from the Report Tools menu on the Microsoft Excel Menu bar.
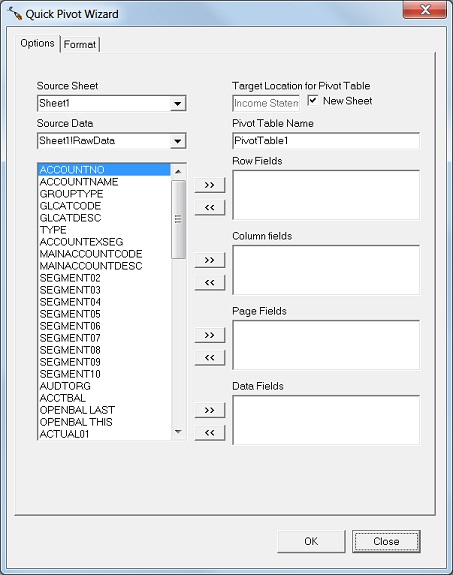
Options Tab
| Source Sheet | Defines the sheet where the data is stored on |
| Source Data | Defines the data source name |
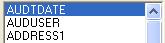 |
The field names that are available for the user to report on |
| Target Location for Pivot Table | Specifies the location where the new sheet will be sent to |
| Pivot Table Name | Defines the name of the new pivot report |
| Row Fields | Dimensions that will be reported horizontally |
| Column Fields | Dimensions that will be reported vertically |
| Page Fields | Dimensions reported on a global level |
| Data Fields | Aggregated measures reported within the content of the report |
Click OK. The report will be created as a new sheet within the specified workbook.
Format Tab

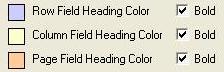 |
Defines colours used within the pivot report. To access additional colour pallets, click the colour box |
 |
Restores original default colours |
| Sum by Default | Uses the Sum Aggregation as default within the report content. If unchecked, the count aggregation is used |
| No Gridlines on Sheet | Removes the grid lines from the sheet |
| Free Window Pane for Data | Freezes the report headings |
| Zoom Sheet to __ % | Zooms the sheet to the percentage specified |
| Apply Number Format | Changes the number format to what has been specified |
| Hide Blanks | Hide all Blanks |
| Grand Total Columns | Includes Grand Total for all the Columns |
| Grand Total Rows | Includes Grand Total for all the Rows |
| Sub Total Row Fields | Gives a Sub Total for the Row fields |
| Auto Sort Fields | Automatically Sorts the Fields |