Default colors
From Matlab plt

Default colors
The first thing most users notice when running plt for the first time is that the traces are plotted on a black background. In fact this can be shocking at first because it is so different from the traditional Windows and Matlab standard color scheme that you may have grown used to. Rest assured however that you are not forced into any color scheme. The next section explains why you may not want to change the defaults, and the section after that explains how this is easily done if you prefer to ignore that advice.
The advantage of the default plt color scheme
 The primary virtue of plt's default black plotting background is that you can distinguish far
more traces based on color alone when compared with Matlab's default white plotting background.
The primary virtue of plt's default black plotting background is that you can distinguish far
more traces based on color alone when compared with Matlab's default white plotting background.
Why is this? Consider the green trace for example. The plt default uses [0 1 0] for the green trace as you would expect. However with the standard Matlab color scheme, the green trace is not [0 1 0] because that is too bright and yields low contrast against the white background. So instead they use [0 .5 0]. But this means that the green is less saturated making it more difficult to distinguish the green from say a black or dark grey. Similar problems happen with some other colors. This is why the Matlab default trace color order only includes seven different colors. Once you define an 8th trace it cycles back around and uses the same color as the first trace. Especially with the thin traces commonly used, seven is about the maximum number of colors most people can distinguish and even that is not easy. However with a black background and when using plt's carefully chosen default trace colors it is not difficult to distinguish at least three times as many traces based on color alone.
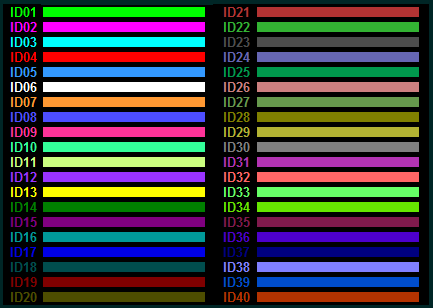
To see that this is true, open the pltn example with 20 traces enabled (i.e. type pltn(20) at the command prompt). Now see if you can match up all 20 traces with the respective trace labels in the TraceID box. If you aren't seriously color blind you probably will find this task easy. Now use the edit box below the TraceID box to change the number of lines to 40. (The 40 trace colors that will be used are shown to the left.) If you have sharp color vision you still probably can identify all 40 traces just by the trace color. You will find that if you switch to a white plotting background, you will be able to identify far fewer traces based on the trace color no matter what trace color sequence you choose. Matlab's standard plot routine doesn't have features that encourage the use of so many traces, and so you probably haven't noticed this problem with the white plot background. However, plt was designed to work well with many dozens of traces and you will likely take advantage of this capability soon ... and in the process you will come to appreciate plt's default color scheme.
Configuring plt to use Matlab default colors (color specification files)
When you type a command into the command window such as plt(x,y) the data specified will be plotted using plt's default colors (i.e. dark background). However if even after reading the previous section you would rather it plot the data using Matlab's default colors, the easiest way to do this is to rename the file pltColor1.mat in the plt folder to pltColor.mat. This is a "color specification file" whose contents are described in the section below. Every time you enter a plt command from the command window, plt will look for this file (pltColor.mat in the plt folder) and will use the specified colors if the file exists. This particular file (until you change it with the methods described below) specifies colors that are the same as Matlab's default color selections.If you call plt from a Matlab script or function file then plt will not use the pltColor.mat file; however, it will look for a different color specification file. Suppose you write a Matlab script called FooPlot.m that contains a call to plt. Then plt will look for a color specification file called FooPlotColor.mat. This file must be located in the same folder that contains FooPlot.m. So to make FooPlot use the default colors, you could copy pltColor1.mat to FooPlot.m. This can also be accomplished by including the 'ColorDef',0 parameter in the plt argument list, however the color specification file method is better if you want to allow the user to easily modify the program's colors from the its graphical interface.
There is one other special color specification file that you can use named pltColorAll.mat. If this file exists in the plt folder it will be used by plt no matter which script or function it is called from and even when plt is entered from the command line. However the colors specified by pltColorAll.mat may be overridden by several methods:
- A color file whose name is derived from the name of the script as explained above will take precedence over the pltColorAll.mat file
- If a color specification file is included in the plt command line (via the 'ColorFile' parameter, of course that is the file that will be used. If the 'ColorFile' parameter includes a null argument (i.e. [] or '', then plt will ignore all color specification files, thereby reverting to the usual plt defaults. Equivalent to the 'ColorFile' parameter with the null argument is to include the string 'IgnoreColorfile' in the argument to the 'Options' parameter.
- Even when a color specification file is being used, any particular
color characteristic may be overridden by the specific plt parameter that
controls that feature. All these parameters are defined in the
Colors section.
Creating or modifying a color specification file
Start by opening any plt figure. It will be easier if you choose a plt figure that is already using colors that is close to what you want. To edit one of the trace colors:- Frist click on the trace that you want to change color.
- Then right-click on the y-cursor edit box
- Select "Properties" from the popup menu by left-clicking on it.
- The edit box in the lower left corner of the small figure that appears contains the color triple for the selected trace. Simply edit the color triple with the value you have in mind. As soon as you hit enter, the color of the selected trace and its associated TraceID label will be changed to the color you entered.
- Or if you don't know the color triple that you want, right-click on the color
triple edit box and a "Color Pick" palette will appear allowing you to choose
the color you want by changing the sliders and then clicking on one of the 100
colors visible in the palette. Learn more about this palette in the description
of the Color Pick pseudo object in the
pseudo object section. - Repeat step one and two, but instead of left-clicking on "Properties", right click instead. A small figure will appear that will allow you to edit the figure colors.
- Select the figure element you want to change with the popup menu.
- As before you can change the color by entering the color triple or by using the color palette.
- After all the colors have been adjusted to your satisfaction, enable the top menu bar by clicking on the "Menu" tag in the MenuBox, then click on the last menu (plt). Select "Save figure colors". You will see a message box that tells you the name and location of the file that was saved. (If your script was called FooPlot, the file will be FooPlotColor.mat. If you called plt from the command line the file will be called pltColor.mat.) If the color file had already existed, it will be overwritten without warning.
clear; cd plt; load pltColor; who;
you will see the following list of variables from the file:
cTRACE - Trace colors (an N x 3 matrix, where N is the number of traces in the TraceID box)
cFIGbk - Figure background color
cPLTbk - Plot background color
cXYax - Axis border color
cXYlbl - Axis label color
cDELTA - Delta cursor color
After editing the variables you want to modify, type save pltColor to make the changes permanent.
The menus used to edit these colors are also described in the